

State Farm
Building a Social Content System for a Local State Farm Office
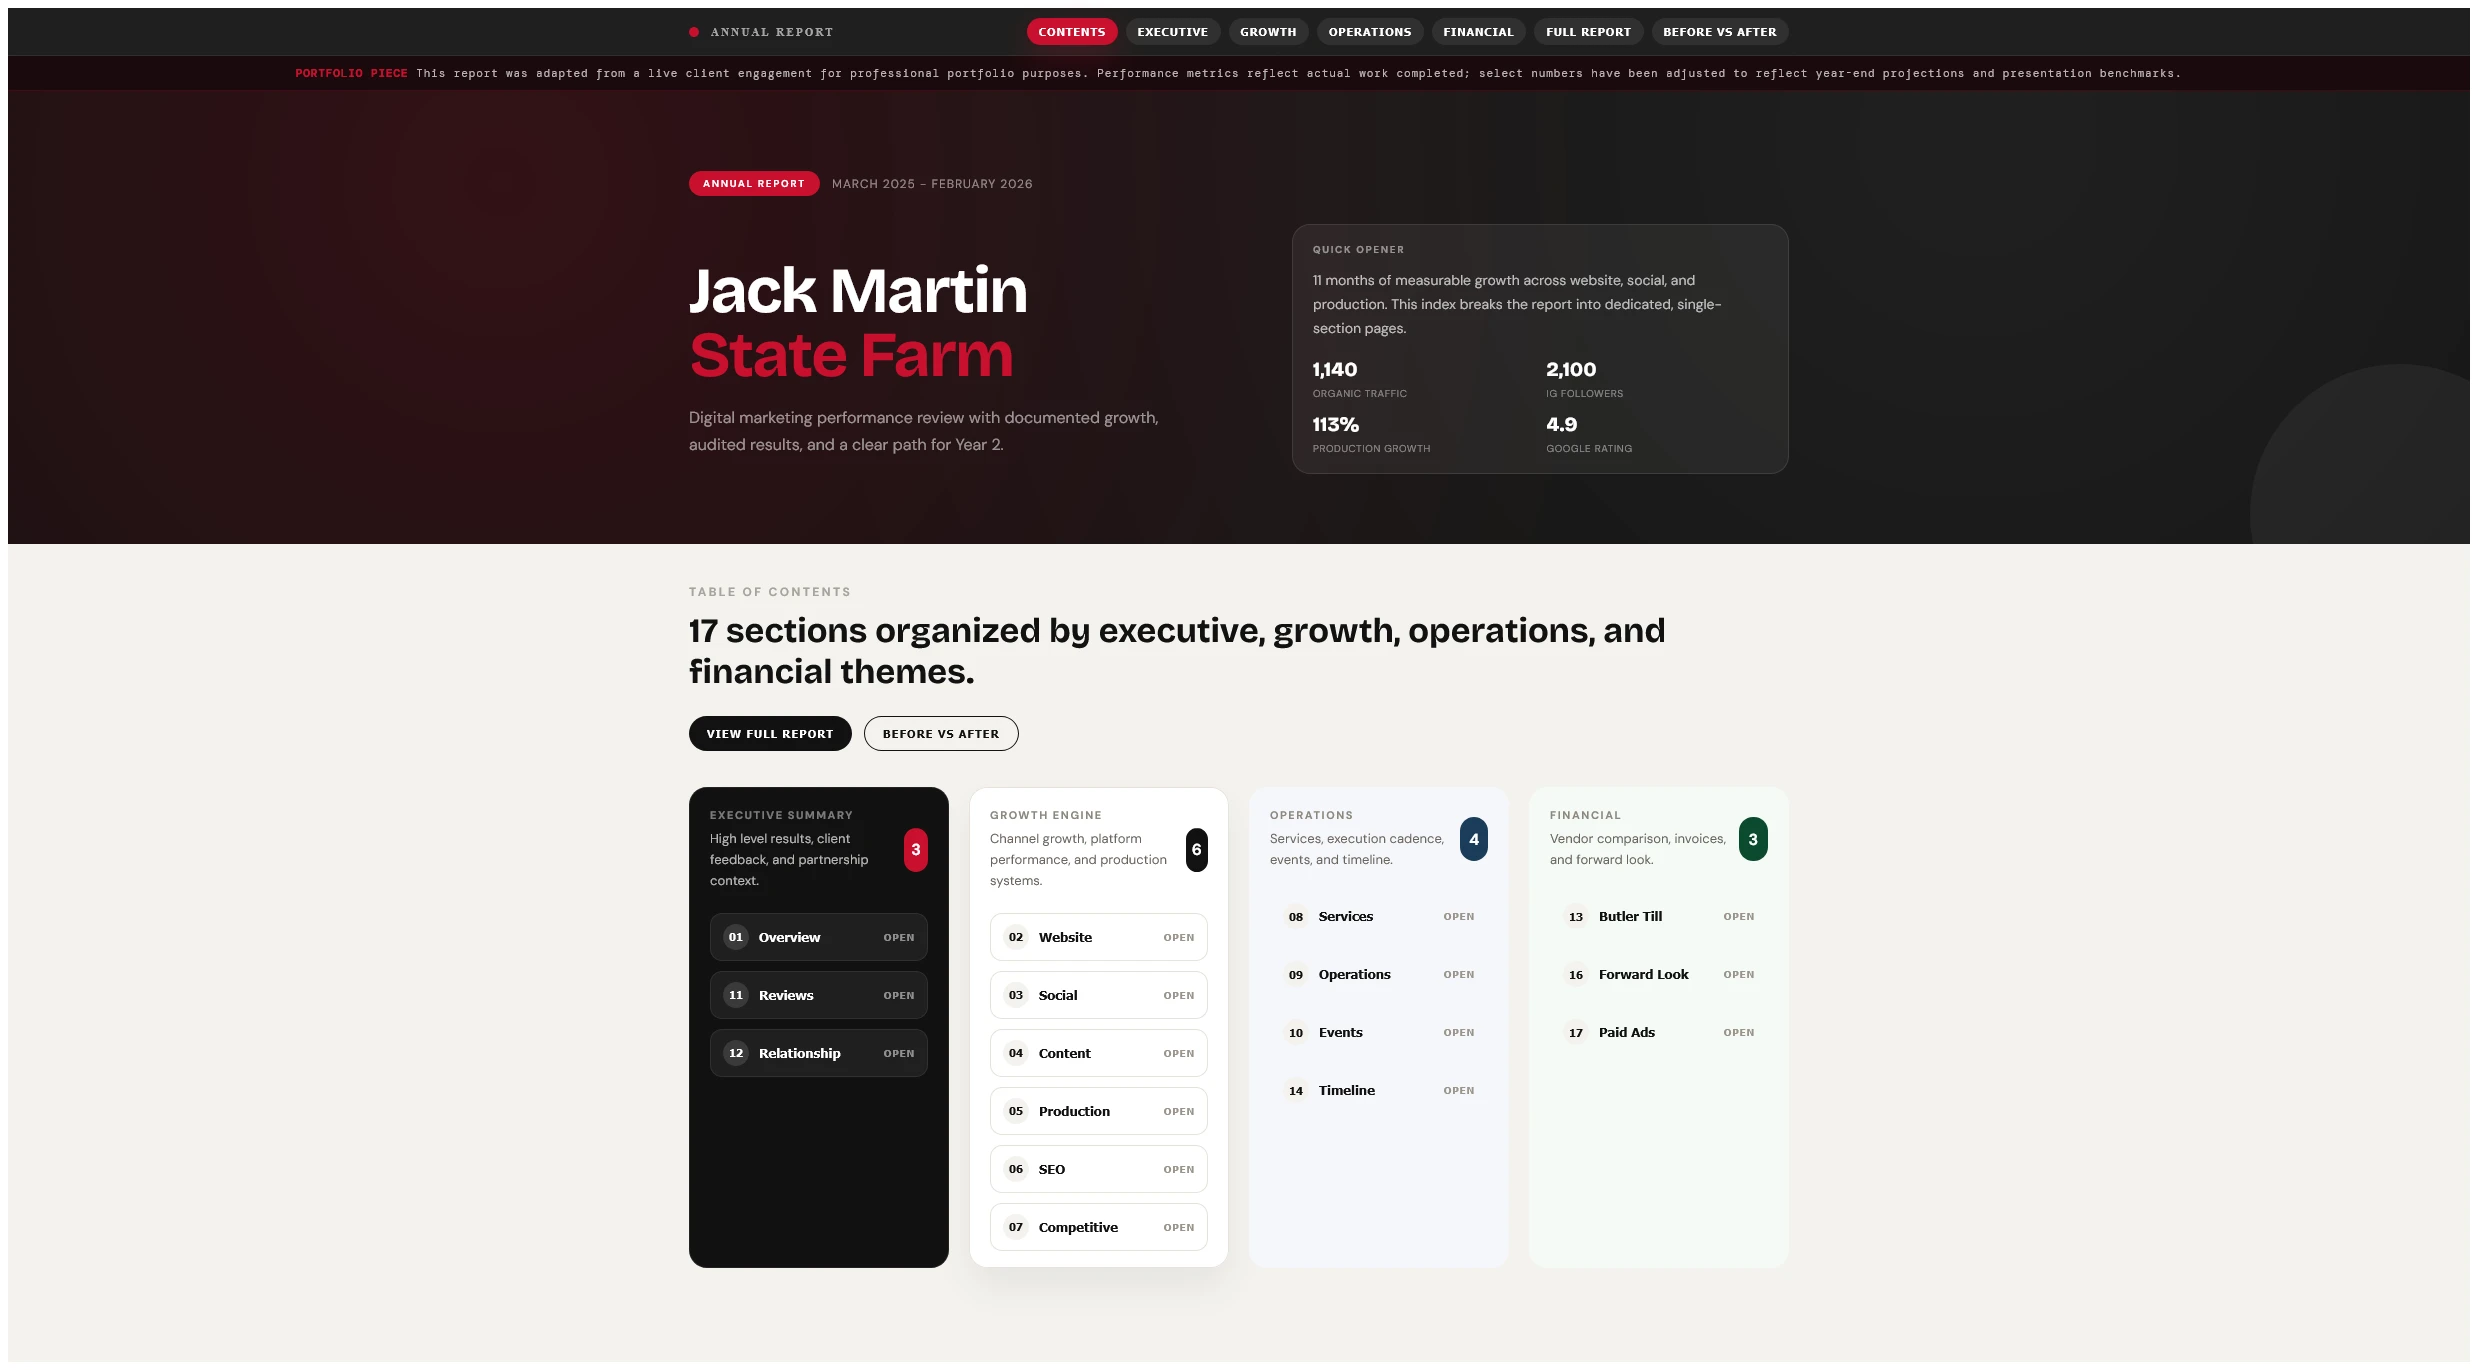
End-to-end social media management for a local State Farm office, including educational reels, brand carousels, TikTok content, and a full digital audit delivered as a live annual review site.
- 85
- Instagram posts
- Over 12 months, plus 50+ on LinkedIn
- 13+
- Videos produced
- Educational reels and trending TikToks
- 5
- Carousel series
- Ask Jack, Meet the Team, Reviews and more
- 17
- Section annual audit
- Delivered as a live review site
A local State Farm office had almost no social presence. They needed a strategy that could educate customers, humanize the team, and compete on TikTok and Instagram within strict corporate brand guidelines.
End-to-end content production, including educational reels, trending TikToks, five recurring carousel series, static posts, and a 17-section interactive annual digital audit.
Results
Short-form video
Educational reels on pet, life, boat and safe-driving insurance, plus trending TikToks that put the agency team on camera.
Carousels and static posts
Five recurring carousel series, including Ask Jack Q&A, Meet the Team and Customer Reviews, plus promotional posts for products, holidays and milestones.
Web and LinkedIn
Content on LinkedIn and Facebook, plus ongoing tracking of the agency website traffic and engagement.
Local presence
Customer-review posts, event coverage and steady local content, all within State Farm brand guidelines.
Each figure above uses its own source and reporting window. See supporting detail below.
Selected work
Static posts, educational reels, trending TikToks, and recurring carousel series for the office's social channels. Totals above include more than what is shown here.
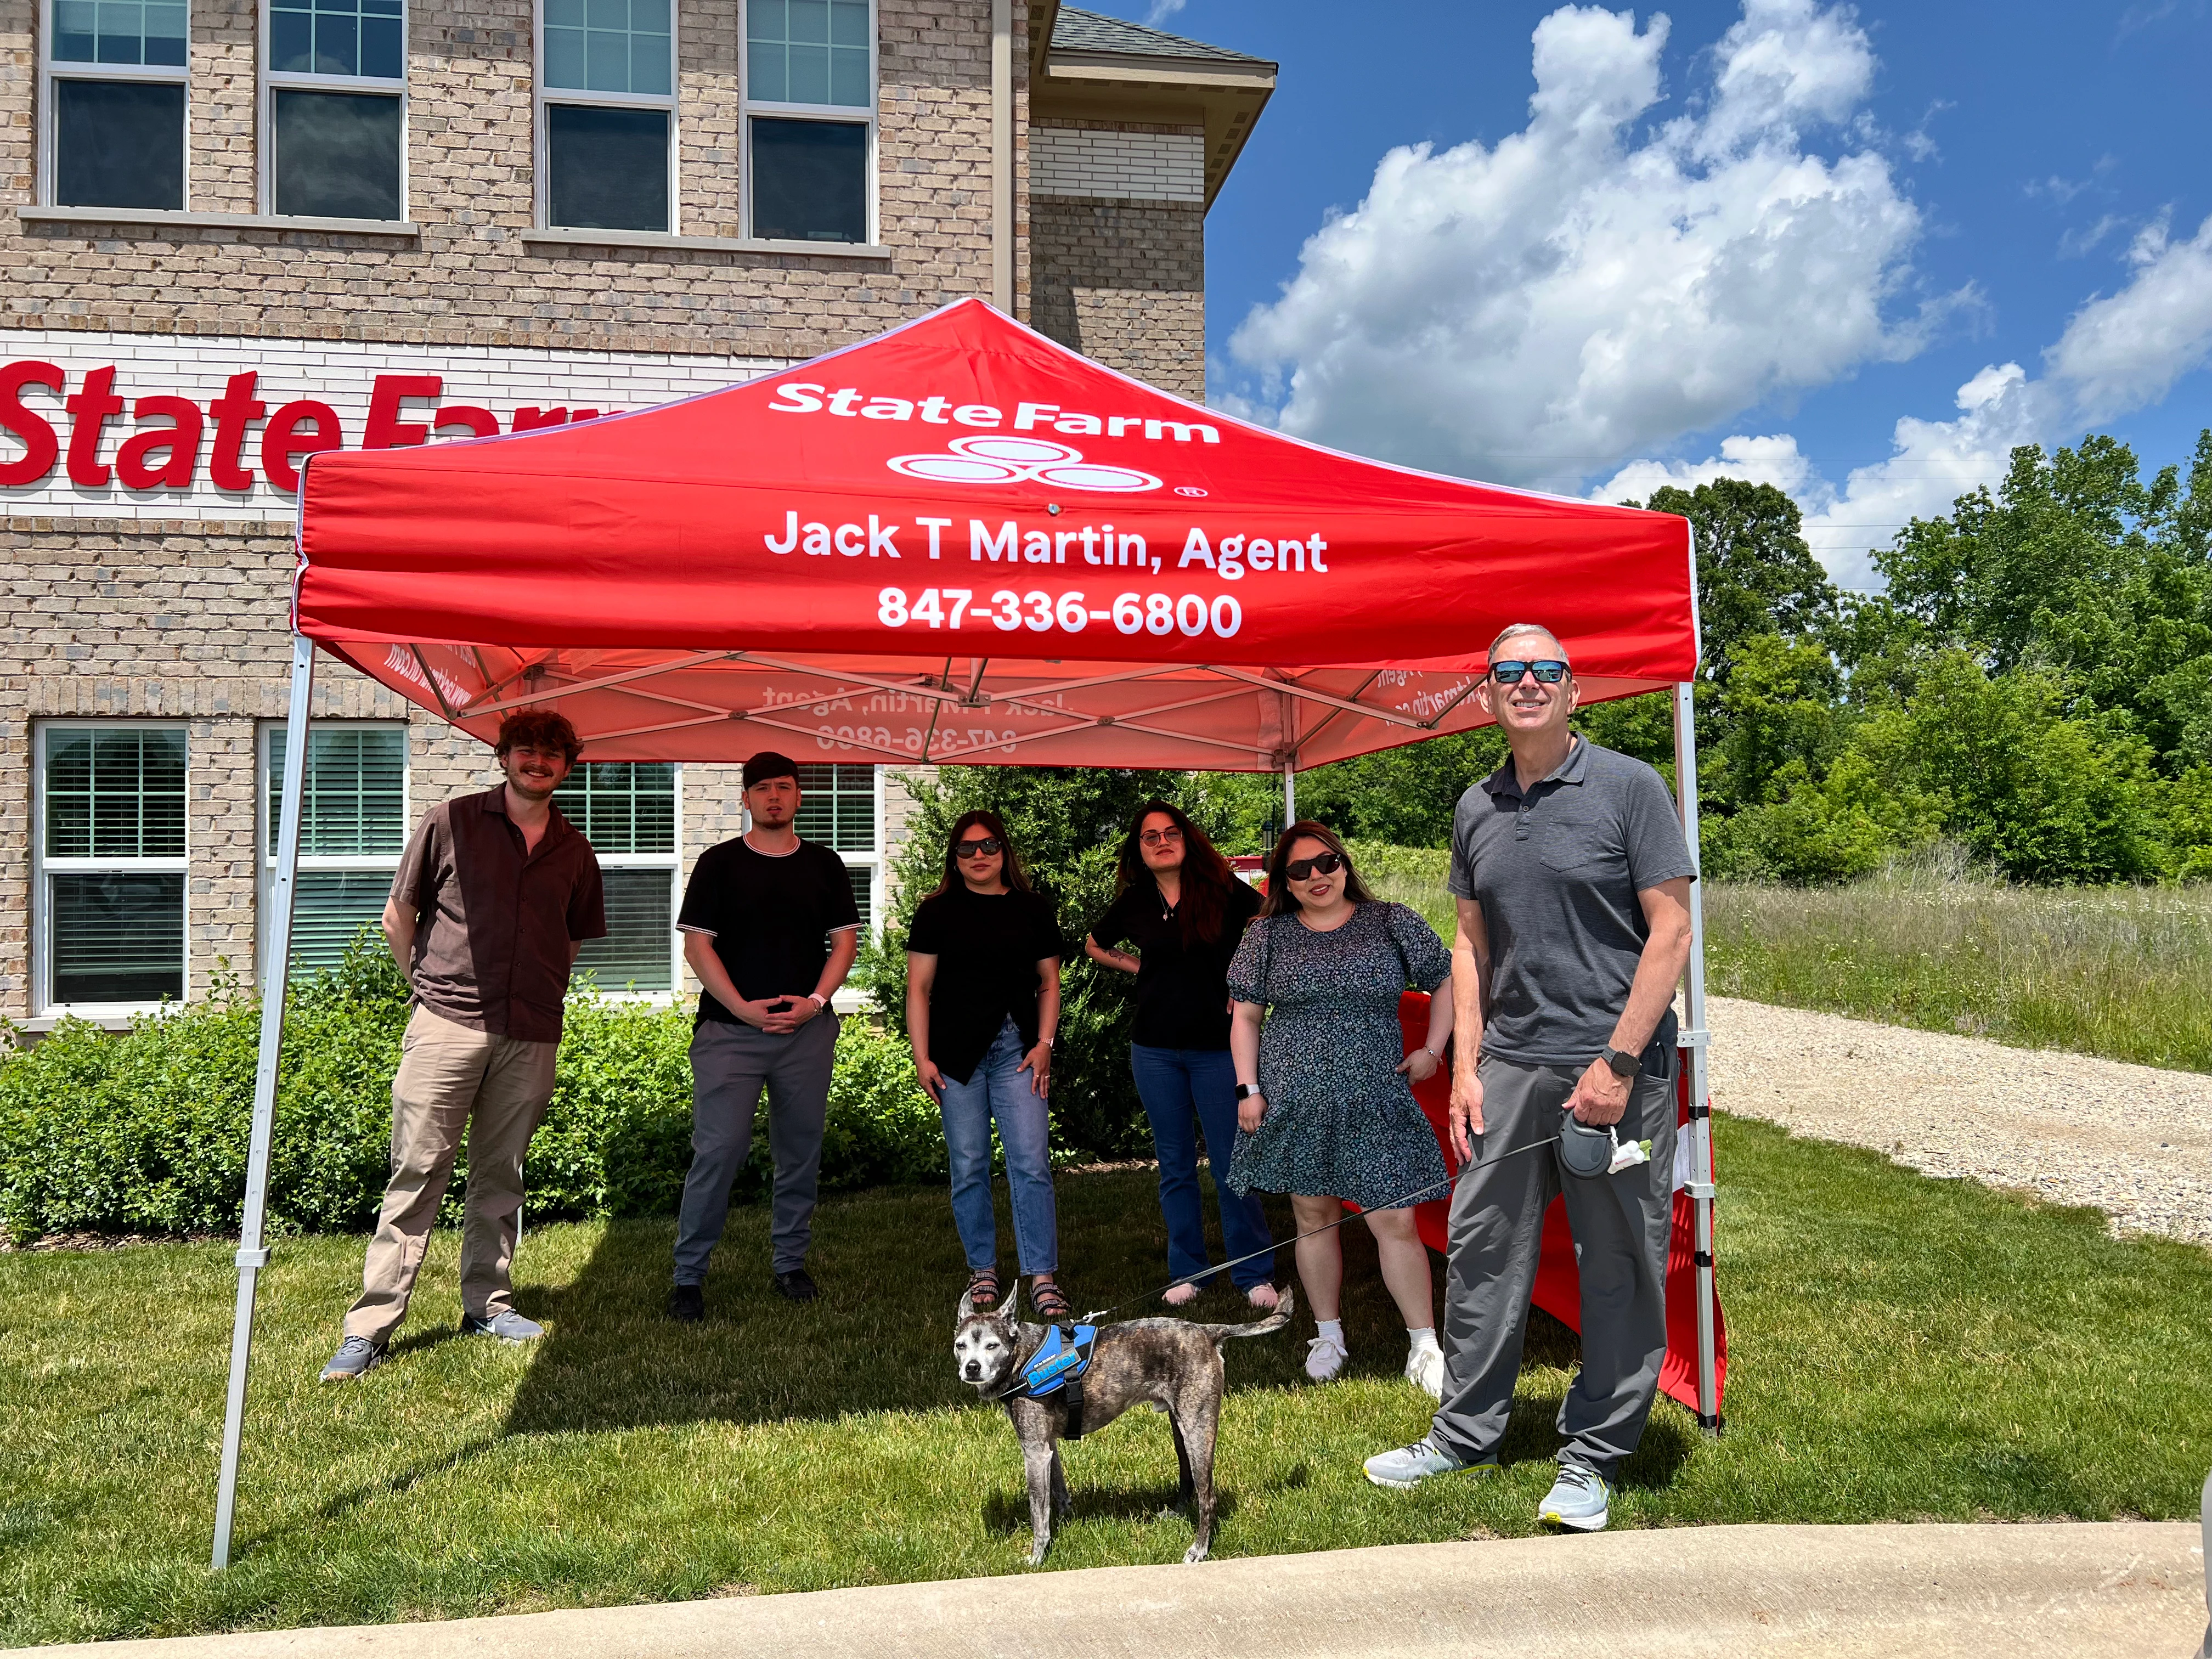
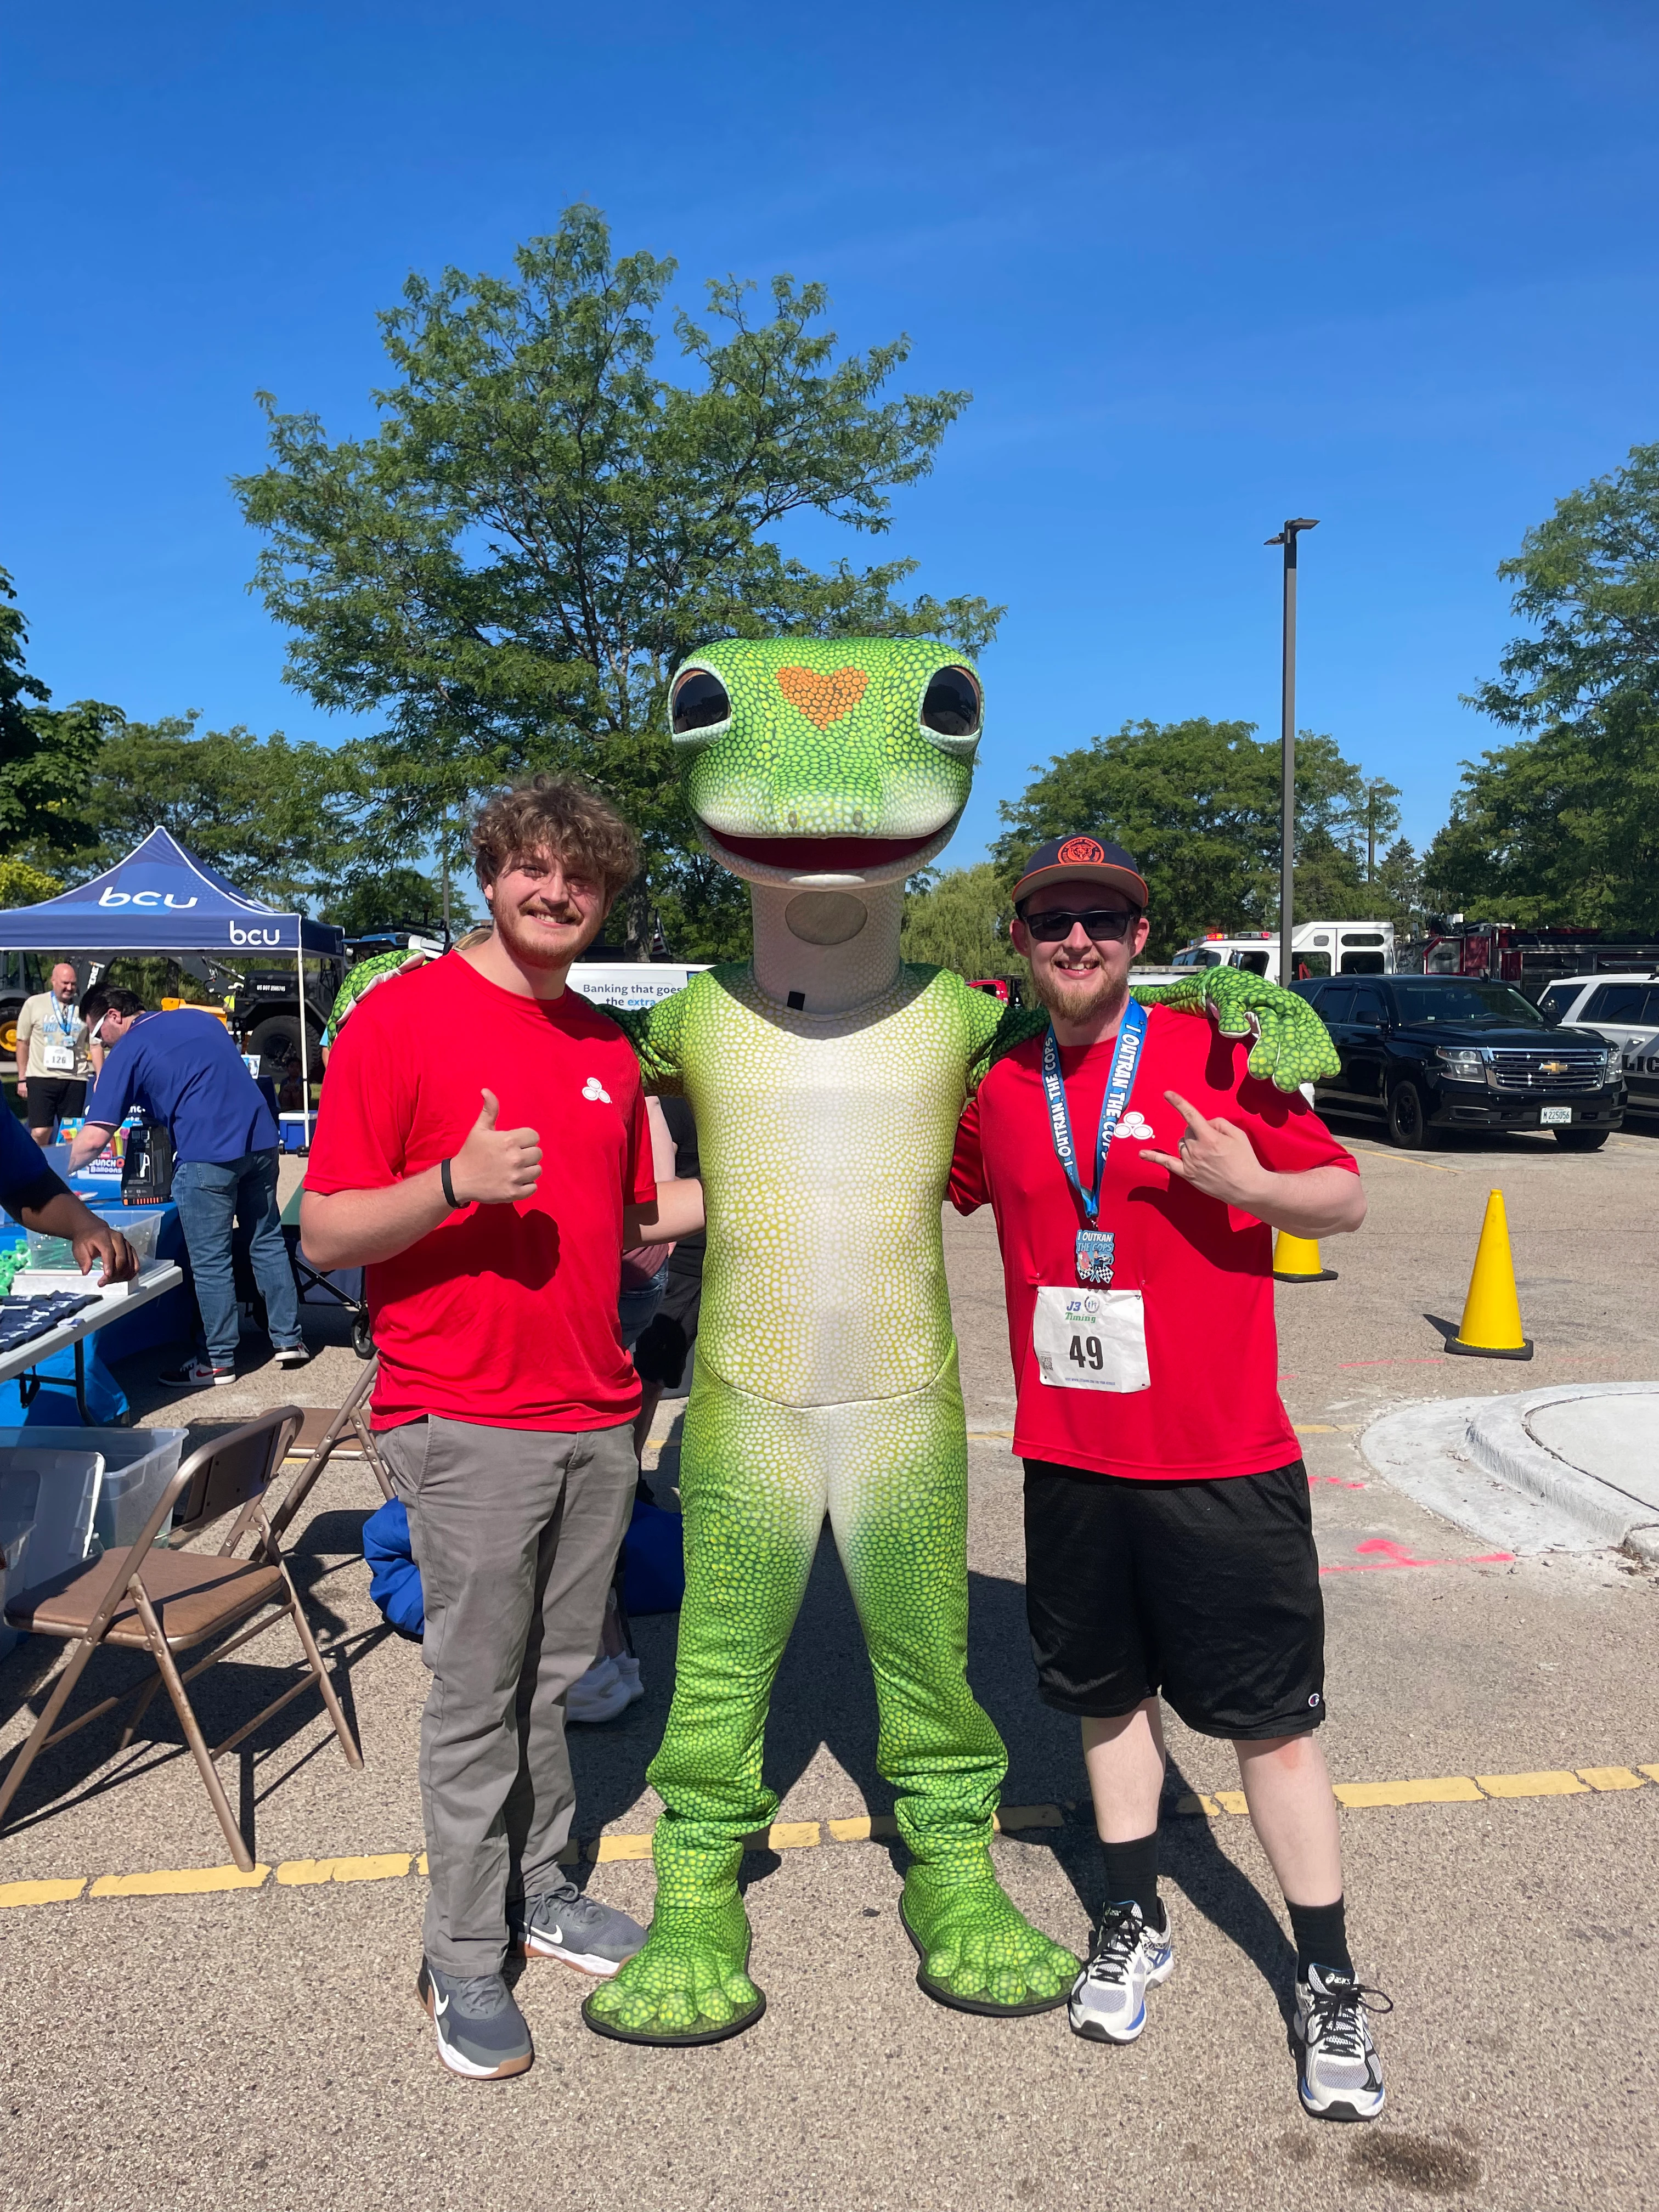
On-the-ground presence at local events, building community connections and capturing content beyond the screen.
More results
Audience and output
- Followers
- 0 → 310
- From launch
- Views from non-followers
- 65.8%
- Reach beyond the existing audience
- Posts published
- 85
- Over 12 months
Website
Monthly traffic and engagement
- Monthly visitors
- 1,842 → 2,142
- Up 16%
- Bounce rate
- 42%
- July 2025, down 8 points
- Session duration
- 2:18
- July 2025 average; 68% mobile
Professional audience, 90 days
- Followers
- 575
- LinkedIn page
- Impressions
- 3,759
- In 90 days
- Professionals reached
- 942
- 72% in Greater Chicago, 28.5% senior-level
Search and reputation
Links, reviews and rankings
- Backlinks
- 104 → 284
- Up 173%; referring domains 58 → 119
- Google reviews
- 143 → 171
- Rating held at 4.8
- Illinois Northeast leaderboard
- Top 10
- All 8 recorded snapshots
Need social content that builds an audience from scratch?
Every great project starts with a conversation. Let's talk about what you need.